Weekend Long Read: Zhou Xiaochuan on the Key Questions Facing China’s Carbon Ambitions (Part I)

Editor’s note: As the former governor of the People’s Bank of China, Zhou Xiaochuan is no stranger to carbon emissions and climate change. At a Caixin conference 10 years ago, he delivered a speech on carbon when the whole room expected to hear insights on monetary policy. His recent analysis of China’s carbon emission ambitions points to a central issue: Key data and methodology to serve as the foundation for China’s 30-60 carbon goal are missing or unclear. They need to be put in place as soon as possible.
President Xi Jinping announced that China will achieve peak carbon dioxide emissions by 2030 and carbon neutrality by 2060. Since then there has been a major shift in how Chinese think about carbon emissions.
When it came to carbon emissions, China used to argue that developing countries should not take on too many obligations, and the financial and technical support for emissions reduction should come from developed countries. Considering its rapid GDP growth, China advocated the use of relative indexes, such as carbon emissions intensity, and made commitments to incremental rather than absolute goals. At that time, it was believed that because China had rather low carbon emissions per capita and a comparatively low level of cumulative historical emissions, there was still plenty of room for China’s continued emissions. But this position is clearly inconsistent with the targets proposed by President Xi. Now the situation demands that China achieve carbon neutrality by 2060 regardless of its GDP growth rate, per capita emissions or cumulative historical emissions. Although there may be a certain degree of flexibility for the 2030 peak emissions target, the ultimate goal of net zero emissions will require plans and actions in absolute terms over the next 30 years.
What’s the 2005 Base Data?
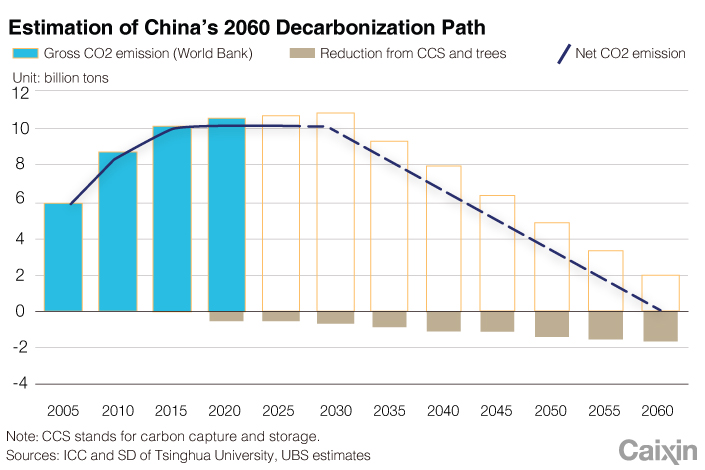
The 2030 carbon peak goal has clarified certain supporting targets such as lowering emissions intensity by 65%, but there is no clearly defined base number of total emissions, leading to wide discrepancies in opinion.
The current lack of a clear-cut yearly plan for total carbon emissions may stem from two considerations: First, continuing to abstain from the use of an absolute index allows more room for playing with figures; second, there could be problems with our basic data work, and data may not be consistent or reliable enough to support further calculations and planning.
The data recognized and used by most agencies indicate that in 2020 China discharged 10 billion tons of carbon, but in 2005, there were no official or authoritative data on China’s carbon emissions. In addition, there are different assumptions about the average GDP growth rate for the next 10 years. Thus each agency has come to different conclusions and made different predictions about the absolute value of the 2030 emissions peak, with estimates ranging from 10.1 billion to 11.2 billion tons.
For example, the Carbon Neutrality Economics report recently issued by China International Capital Corp. Limited (CICC) cites 10.8 billion tons as China’s 2030 peak carbon dioxide emissions, but CICC didn’t have accurate data for 2005 either. Their estimate was calculated according to data released in 2017 and that carbon emissions intensity has reduced by 46% from 2005. In addition, CICC assumed an annual average GDP growth rate of 5% over the next decade. Even though another agency took the same growth rate as its basis for calculation, that agency calculated a peak value of 10.1 billion tons of carbon.
This is obviously caused by inconsistent bases and indexes for 2005 (gross emissions vs. net emissions, carbon dioxide vs. greenhouse gases, for example.). Diverse calculation bases generate diverse planning data. This fact requires careful consideration.
At the Climate Ambition Summit, President Xi announced additional commitments for 2030: China will lower its carbon dioxide emissions per unit of GDP by more than 65% from the 2005 level, will increase the proportion of nonfossil fuels in primary energy consumption to approximately 25%, will increase the volume of forest stock by 6 billion cubic meters from the 2005 level, and will bring its total installed capacity of wind and solar power to more than 1.2 billion kilowatts.
Two of the four targets have relevance to the 2005 data, but so far, no official or authoritative data have been made available for that year. Thus, we can only guess or work out estimates based on different assumptions. The public will certainly suspect that the data work was not done well — or lacks transparency, that the authorities refuse to release official figures.
What’s the Average GDP Growth Rate in the Next Decade?
If tasks are to be arranged and implemented according to carbon emissions intensity in 2030, GDP comparability must also be taken into account.
Predictions of annual average GDP growth for the next decade vary from person to person. Some use 5%, some 5.5%, others 6%, and more. Nevertheless, it is clear that comparable GDP, rather than nominal GDP, should be used to measure and compare carbon emissions intensity to formulate a comparison to GDP in 2005. Comparable GDP can be calculated according to the GDP deflator or growth rate data. Either way, there can be no disagreement on this metric.
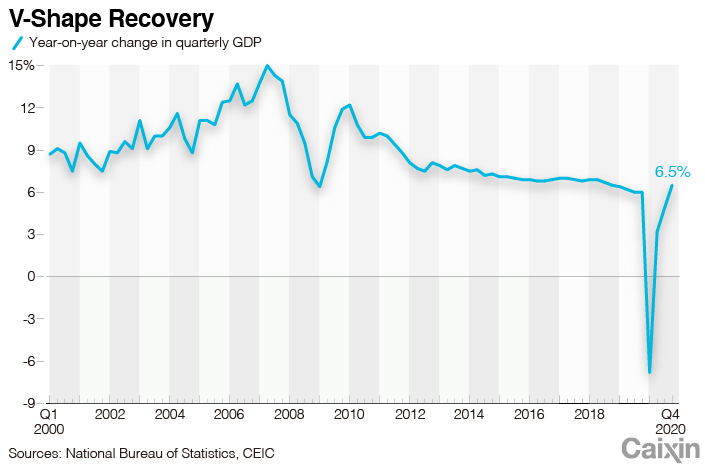 |
Still, statistics must be treated with caution. When it comes to the growth rate, there are sometimes huge gaps between data from the beginning of a year (the preliminary accounting figure), the preliminary verified figure, the final verified figure and the revised figure (especially in 2005, 2006 and 2007). To take 2007 as an example, the figures for GDP growth rate started at 11.4% before subsequent revisions to 11.9%, 13% and 14.2%, demonstrating a gap of 2.8 percentage points. If comparable data are not used, then the discrepancy in calculated carbon emission intensities will be quite pronounced. In addition, if the targets are measured by the reduction in emissions intensity, there will be more flexibility for China’s 2030 target so long as the GDP growth rate reaches a certain level.
Some people have pointed out that if authorities already know the rate of China’s reduction in emissions intensity since 2005, and the GDP growth rates or the GDP deflators during this period are relatively reliable, then it should be impossible for them to not know the total carbon emissions figure for 2005. Otherwise, how could they have come to the conclusion that carbon emissions intensity fell by 46% from 2005 to 2017? There seems to be a contradiction here.
Technically speaking, if there is no annual total figure, how can emissions reduction tasks be broken down? How can performance be assessed? How can the carbon market set a price? We have no way to answer these questions. In addition, a clear total amount also has implications for the dynamic arrangement of the entire emissions reduction process for the next 40 years — whether to move fast in the early stage and more slowly in the later stage, or first slow and then fast, or to aim for steadier progress, and how to optimize choices.
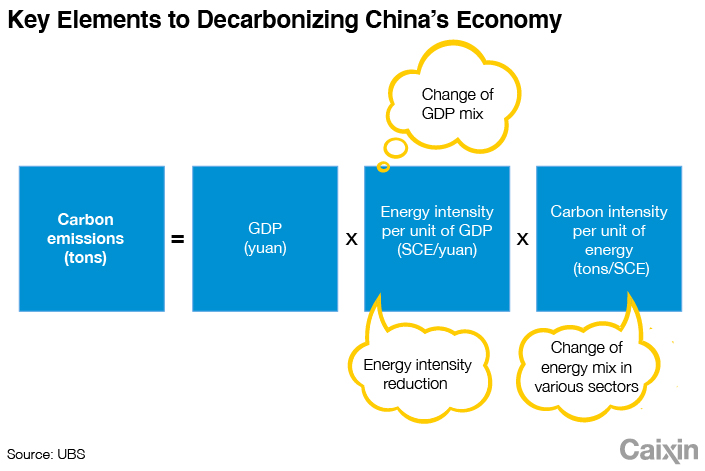 |
Moreover, we need to be able to evaluate the progress and accomplishments in emissions reduction over the past 15 years (2005–20) and to define our desired progress for this decade (2020–30) to better implement relevant measures and realize targeted emissions reduction.
All things said, when it comes to planning or an actual timeline, choosing the optimal schedule (loose then tight or tight then loose) requires a solid foundation of data, measurement and analysis. In particular, we must have a clear quantity goal for total carbon emissions.
Where Is the Focus?
Once a clear goal is set for total emissions, all industries should take emissions reduction seriously and take actions to achieve it. But on the whole, the focal points of emissions reduction need to be made clear. “Carbon emissions” is a narrow concept; we should also consider greenhouse gases (GHGs) like methane. Of course, as carbon dioxide accounts for more than 90% of GHG emissions, it is only right to give it priority.
What is the major factor here? As many already know, it’s the power generation industry. This industry alone contributes 41% of all global carbon emissions; in China, the figure is even higher, with power generation contributing 52% to national carbon emissions.
In the future, we will increasingly replace fossil fuels with electricity in power consumption and transition to green or zero-carbon methods to generate electricity. It is estimated that electricity will account for 70% or more of all power by 2060. This makes electricity our major focus. If the energy transition to electricity fails, there will be no way to meet our ultimate emissions reduction goal.
Achieving President Xi’s commitment to increase the proportion of nonfossil fuels in primary energy consumption to 25% by 2030 will be an arduous task. In 2019, the proportion was about 15%. But hitting that target is not unreasonable.
Can We Rely on Wind and Solar?
The president’s vow to expand installed capacity of wind and solar power to more than 1.2 billion kilowatts, or 1.2 terawatts (TW) is likewise quite doable, especially considering improvements in equipment manufacturing and installation capabilities as well as a gradual increase in price competitiveness. Current installed capacity totals about 0.056 TW. A 50% increase would mean average new installed capacity of 0.084 TW; after 10 years this would reach 0.84 TW, which along with the existing accumulated installed capacity of 0.41 TW (2019 data) would bring total installed capacity to 1.2 TW.
However, we should note that some analysts are over-optimistic about the effect that the energy transition to electric power will have on emissions reduction and tend to neglect the technological difficulties entailed when power supply, transmission and distribution are no longer based on fossil fuels.
Although improvements in wind and photovoltaic power technologies have significantly reduced the costs of installation and operation, increasing their proportion in total power generation will depend not only on progress in installation but also on improvements in a number of R&D technologies. No one should assume that the electric power industry will have a negative green premium (that’s clearly over-optimistic).
Installed capacity must be transformed into annual power supply through analyses of average annual generating hours and grid capacity. Here is where the average annual generating hours of different power generation equipment come to play a critical role. I’d like to equip economists who lack expertise in electric power with a set of concepts (approximate figures are given for more convenient recall): The average number of annual generating hours for photovoltaic power total 1,500; for wind power, 2,500; for hydropower, 3,500; for coal or thermal power, 4,500–6,500; and for nuclear power, 7,500.
These figures reveal the large difference in average annual generating hours among different power generation sources. In China, the actual figures are even lower, with less than 1,300 hours for photovoltaic power (and less than 1,000 hours in regions with weak sunlight), just 2,100 hours for wind power and 4,200 hours for thermal power (though it can potentially reach more than 6,000 hours). Thus, we should be conservative when estimating the proportions of photovoltaic power and wind power in total electricity generation, despite their fast-growing capacity installation.
In addition, due to the intermittency of renewable energy, it requires a high-tech grid and energy storage equipment, which themselves may rely on technological developments yet to be made.
China has a high demand for long-distance power transmission because its wind and sunlight-rich regions (where annual generating hours are higher than the average) tend to be far from population centers and industrial clusters. Although UHV electricity transmission and substation technology is relatively mature, the amortization and line loss costs of construction (about 6% at present) cannot be ignored. These technological and economic factors are inherently related to the phenomenon of wind and photovoltaic curtailment. Therefore, it is blindly optimistic to predict that China will take the lead in emissions reduction based on the rapid growth of wind and photovoltaic power capacity installation alone. In fact, relying on wind and photovoltaic power to realize the “30-60” target is a monumental task dependent on considerable investments in R&D.
Is the 14th Five-Year-Plan too Conservative on Cutting Coal Usage?
In the power generation industry, emissions reduction particularly depends on lowering the consumption of coal.
Considering China’s high level of coal dependence, reducing coal consumption should be the first step to cutting down on fossil energy use. There is a figure that deserves a special mention in this context. During China’s “Two Sessions” of the National People’s Congress and the Chinese People’s Political Consultative Conference this year, the China National Coal Association issued a report declaring that by the end of the 14th Five-Year Plan period, China’s annual coal output will be controlled within 4.1 billion tons.
What does this mean? In 2012, China’s annual coal output reached 3.9 billion tons. It then decreased slightly before returning to 3.9 billion tons in 2020. That 4.1 billion figure in the 14th Five-Year Plan is not an encouraging number, as it suggests an increase of more than 100 million tons. This high cap on annual output will only make it more difficult to complete future goals for emissions reduction.
But there may be another possibility. The 14th Five-Year Plan was formulated before President Xi delivered his speeches at the United Nations and the Climate Ambition Summit, so its carbon targets, content and emissions reduction goals were relatively weak. It is worth considering whether these indicators and action plans are in need of reevaluation.
Where Is the Capital?
Besides the issue of converting installed capacity to power generation, I’d like to bring in another topic for discussion: the amount of investment needed for increases in new installed capacity. These investments primarily consist of installation costs, but the grid, energy storage, peak load regulation and power transmission and distribution costs must also be taken into account. If only looking at wind and photovoltaic power’s costs of installation, these have already been reduced to exciting numbers lower than those for thermal and nuclear power. Nuclear power is the most expensive, though its annual generating hours surpass 7,000 once operational. At present, thermal power still offers the most competitive return on investment, but the dramatic emissions reduction requirements may generate demand for carbon capture and storage (CCS) equipment and relevant investments, thus significantly increasing investment costs for thermal power in the future.
Moreover, CCS has a high operating cost, increasing auxiliary power consumption by 20%. As CCS technology is still immature, China will need to make targeted efforts at improving it. When considering future investments in the power industry, all of the costs associated with a renewable energy supply must be taken into account, not just the cost of installation. Then we must ask how future investments in the power industry are to be recovered. If there are to be sufficient incentives to attract investment, compensation will need to come not only from power supply revenue but also from profits in the carbon market or via the carbon tax.
How Do We Classify Industries and Target Their Emission Cuts?
Then in terms of industry structure, China used to calculate the carbon emissions of the primary, secondary and tertiary industries according to the production method. Calculations identified the secondary industry as the largest emitter of carbon, accounting for nearly 70% of the entire power industry.
But China’s methods for classifying carbon emissions are different from those of other countries, so direct international comparisons are not appropriate. In Europe and the U.S., power generation emits the most carbon, followed by transportation and building materials (including steel for construction) and then the thermal insulation industry. If great efforts are made to reduce carbon emitted by power generation, transportation and building materials, the emissions problem will be more than 80% resolved.
 |
This classification method puts more emphasis on the energy consumption and carbon emissions that relate to human habitation — which requires buildings, urbanization, a certain amount of infrastructure and heating and cooling. Meeting these requirements demands large amounts of steel, cement and aluminum products. The production of these three generates more than half of the secondary industry’s total carbon emissions, so we should pay it great attention. When most housing-related carbon emissions are categorized under the secondary industry, there are easily misunderstandings.
Of course, the steel and building material industries will replace existing production technologies that are based on coal, oil and natural gas with clean electricity and green hydrogen, thereby shifting the burden for emissions reduction to the power generation industry. In this regard, green transformation becomes more crucial in the power industry. In addition, China is in a stage of rapid urbanization but pays little attention to buildings’ thermal insulation performance. Insulation issues will surely account for a significant proportion of carbon emissions in the future. In short, the industry structure should be first clarified and then improved. This requires a large amount of basic data, parameters and measurement as well as a variety of well-designed indicators and systems to form a reasonable and sufficient incentive mechanism.
This article is adapted from a speech delivered by the author at the Seminar on the Realization Path and Economic & Financial Influence of “Peaking Carbon Dioxide Emissions by 2030 and Achieving Carbon Neutrality by 2060.” There will be two parts.
Translated by Lan-bridge Communications
Download our app to receive breaking news alerts and read the news on the go.
Follow the Chinese markets in real time with Caixin Global’s new stock database.

- PODCAST
- MOST POPULAR


